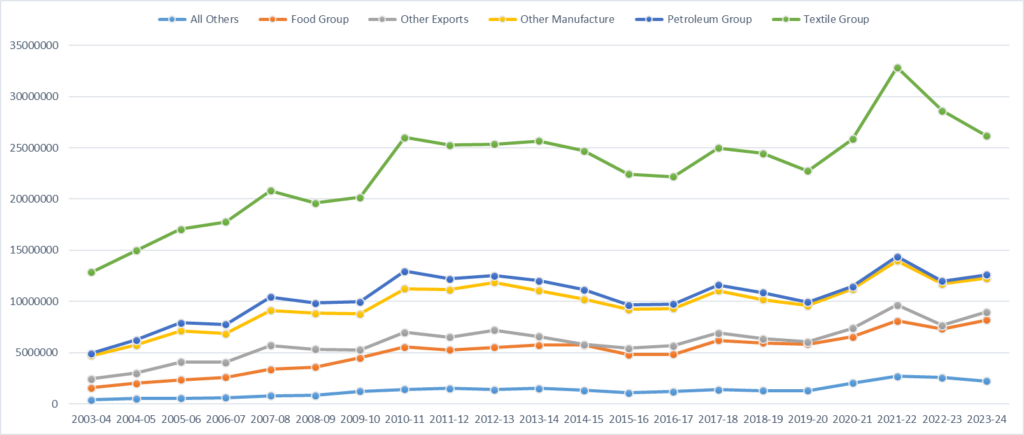
This article presents analysis of Exports from Pakistan. The span period of the analysis is 2003 to 2024. Pakistani exports in 2003 were $12.8 billion and it reached $32 billion in 2022. Since then it is declining and in first 10 months of 2024 is $26 billion. Approximately 22% decline since 2022.
Biggest Export of Pakistan
The trend chart below is self explanatory. Textile group in Pakistan’s export is the leading one. You can say it biggest export of Pakistan. followed by Food group and other manufacturing respectively.
It is clearly evident, that the current policies of the government are proving deteriorating for exports. But real question is why are these policies so rigid?

Export of Pakistan
The amounts in table below are given as “000” (thousand) USD. This table presents sub-group of products. When you scroll down, you can see that rice has highest share in our exports. This means we are exporting agriculture output as raw material for international manufacturers. Leather products and Sports goods are loosing share in total export. This small analysis gives so many insights for policy makers.
Pakistan Export Product List

The values in the table below are percent share of any product in total exports.

You can review the simple analysis and share your feedback in the form of comments.


